
Risk assessment
Risk matrices: why likelihood × severity deserves a closer look
What multiplying category scores can conceal, and how an explicit likelihood–severity combination can make risk decisions clearer.
A familiar risk-assessment form asks the assessor to select likelihood and severity scores, multiply them, and assign a colour. The arithmetic is easy. The harder question is what the resulting number actually tells the decision-maker.
Cox’s research identifies important limitations of risk matrices, including poor resolution, possible ranking errors and ambiguity in inputs and outputs. These findings support careful use of matrices, rather than treating their categories as precise measurements. [1]
Category numbers are not automatically measured quantities
Consider a scheme in which likelihood runs from 1, “rare”, to 5, “almost certain”, and severity runs from 1, “minor”, to 5, “catastrophic”. These are ordered categories. Assigning the number 4 does not, by itself, establish that the underlying likelihood or harm is twice that represented by 2.
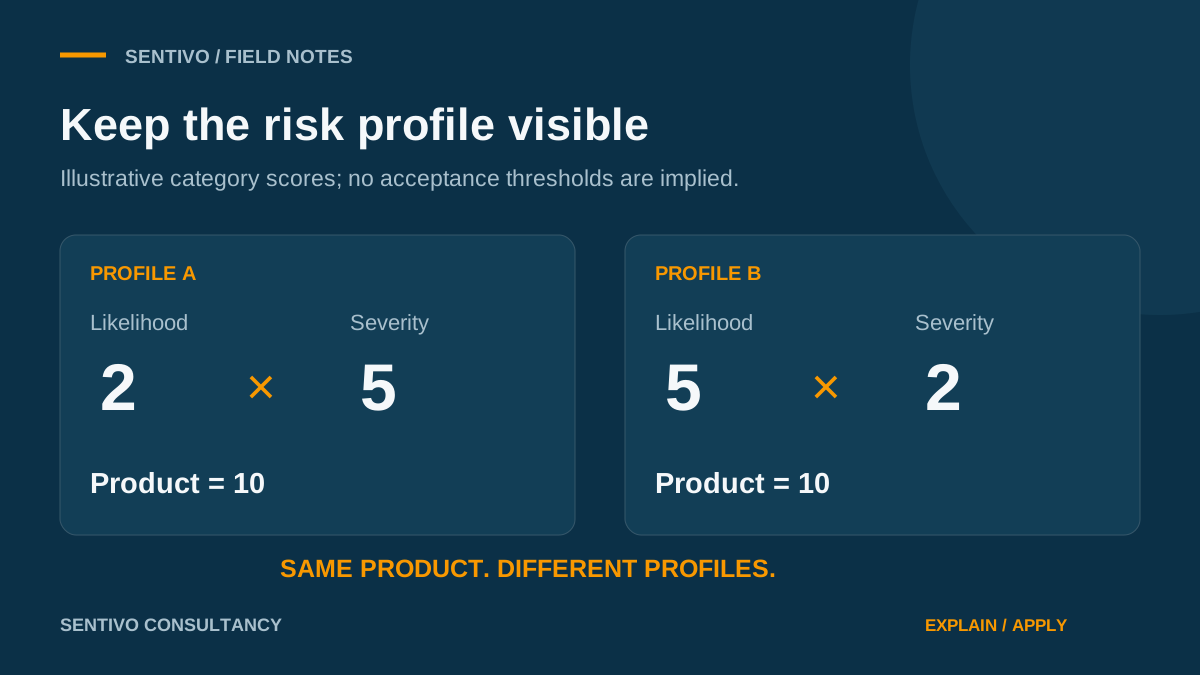
This is a measurement distinction: multiplying category labels produces a score, but the labels alone do not justify interpreting that score as a measured amount of risk. The following arithmetic example illustrates the concern; it is Sentivo’s explanation, not a result quoted from Cox.
| Profile | Likelihood category | Severity category | Product |
|---|---|---|---|
| A | 2 | 5 | 10 |
| B | 5 | 2 | 10 |
The two products are equal. The profiles are different. The multiplication alone cannot tell us whether either scenario is acceptable, which controls are required, or whether one needs specialist review. Neither profile should be prioritised solely from this example.
What the product can conceal
A single score removes the visible distinction between its two inputs. Broad categories also group different underlying situations together. Cox describes this compression and shows that some matrix designs can misorder risks. These are limitations of matrix design and interpretation, not proof that every matrix decision will be wrong. [1]
Changing the colours without examining category boundaries and decision rules leaves these questions unresolved. A label such as “medium” needs an explanation of what action follows and why.
Use an explicit combination rule
Sentivo’s proposed approach is to retain the likelihood–severity pair and use an approved lookup table to assign the required response. Each cell represents a documented decision rule. The rule might require further analysis, a specified approval level or verification of particular controls.
For example, an organisation could require specialist review for every credible catastrophic-consequence scenario, even where the assessed likelihood is low. That is an illustrative governance choice. It is not a universal threshold or a requirement established by the cited paper.
A combination table has a practical transparency advantage: its policy choices can be inspected cell by cell. It does not remove uncertainty, subjective categorisation or the limitations of broad bands. Those concerns still require attention. [1]
Questions to ask before changing your matrix
- Are likelihood and severity categories defined clearly enough for the intended work?
- Does likelihood refer to the specified harmful outcome, over a stated exposure or time basis?
- Can the assessor record the scenario, assumptions, existing controls and uncertainty?
- Does every cell lead to a clear action and responsibility?
- Have credible scenarios been used to challenge the ranking and escalation rules?
This checklist is Sentivo’s proposed review method, informed by the research limitations above. A defensible assessment needs a reasoned control decision and traceable assumptions. The score is only one part of that record.
Sources
References were checked on 30 October 2026. Numbered links connect factual claims to these sources. Examples, checklists and proposed applications identified as Sentivo’s are editorial recommendations; they are not quoted requirements or claims of proven results.
- Cox, L. A. Jr. (2008). What’s wrong with risk matrices? Risk Analysis, 28(2), 497–512. DOI: 10.1111/j.1539-6924.2008.01030.x. (opens in a new tab)Research abstract: limited resolution, possible ranking errors, subjective interpretation and the need to explain embedded judgments.